
HOW I BUILT THE SITUATION ROOM
It started with a notification at 2 AM.
I was scrolling through Twitter, trying to piece together what was happening in the Middle East. One account said airstrikes. Another said it was false. A third posted satellite imagery that may or may not have been from that day. CNN was 45 minutes behind. Al Jazeera had a different story. Reddit was a warzone of its own — misinformation, panic, and buried somewhere in the noise, actual ground truth.
I thought: there has to be a better way to see everything at once.
Not a news site. Not an app that sends you push notifications 20 minutes late. I wanted a command center. A single screen where I could see the globe, the conflicts, the satellite passes, the market panic, the internet shutdowns, the social media chatter, all of it, live, in real time.
So I built one.
What the Situation Room Actually Is
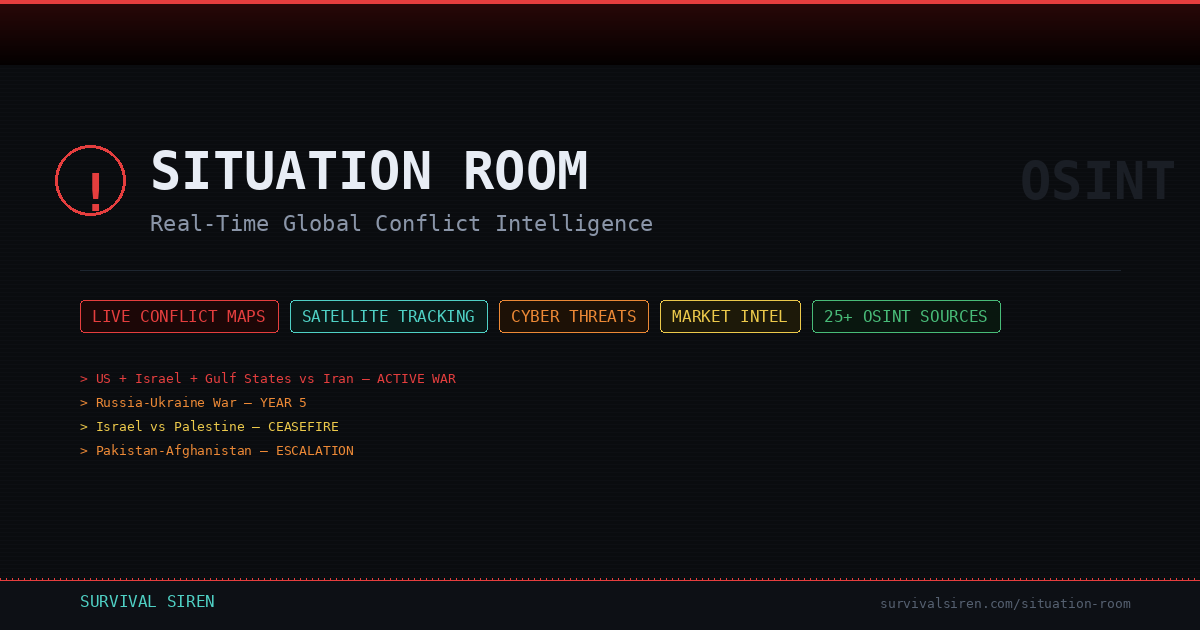
The Situation Room is a free, open-source intelligence dashboard that aggregates data from 25+ verified OSINT sources into a single interface. No login. No paywall. No backend server. The entire thing runs in your browser.
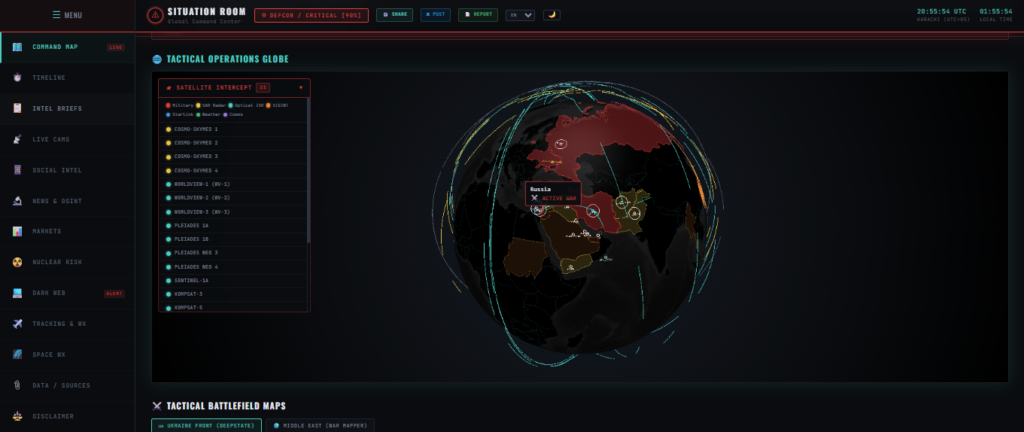
When you open it, you see a 3D tactical globe with satellite orbit paths traced in real time. Conflict zones pulse red. Strike arcs animate between nations. A proximity alert tells you if you’re in a monitored region. Below that, theater cards break down each active conflict with live developments fed by AI analysis.
It has live news from GDELT (the world’s largest open conflict database), UN Security Council feeds, market indicators that track war-economy correlations, a nuclear threat assessment panel, cyber warfare monitoring via Kaspersky’s live threat map, flight tracking over conflict airspace, naval vessel monitoring in strategic waterways, and a whole lot more.
The thing that surprises most people: there is no server. Zero. It’s a single HTML file. Every API call, every data transformation, every visualization, it all happens client-side in JavaScript. Your browser IS the intelligence processing center.
The Philosophy: Why Open Source Intelligence Matters
Here’s what most people don’t realize: about 90% of actionable intelligence comes from publicly available sources. The CIA has said this. MI6 has said this. The stuff that matters, troop movements visible on satellite imagery, shipping data from AIS transponders, social media posts from people on the ground, BGP routing changes that indicate internet shutdowns, it’s all out there. You just need to know where to look and how to aggregate it.
The Situation Room doesn’t generate intelligence. It doesn’t fabricate data or editorialize. It connects to public APIs and open data streams that already exist, and presents them in a way that gives you situational awareness. The same data that analysts at think tanks pay thousands for, rendered in a free browser dashboard.
That’s the whole point. In a crisis, information shouldn’t be locked behind a paywall.
How It’s Built
The Globe
The centerpiece is a WebGL globe rendered with globe.gl. Country threat colors (red for active war, yellow for affected, orange for monitoring) are applied dynamically to GeoJSON polygons pulled from Natural Earth data.
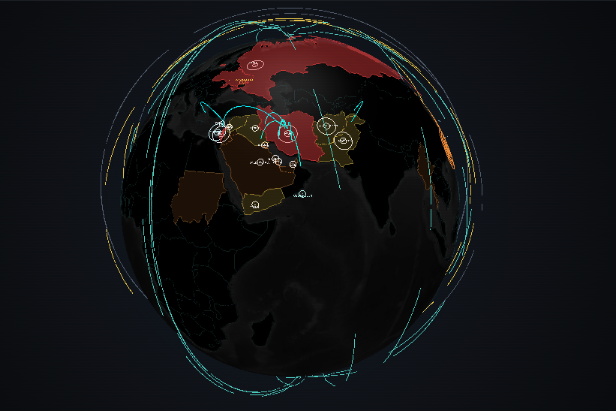
The satellite tracking is real. It uses actual TLE (Two-Line Element) orbital data from CelesTrak, propagated with satellite.js to calculate real-time positions. When you see an orbit path crossing over Iran, that’s a real satellite — COSMO-SkyMed, WorldView, Pléiades and its position is mathematically accurate to within a few kilometers.
The Data Pipeline
The hardest part wasn’t building the UI. It was getting the data to flow reliably from a dozen different APIs, each with their own quirks, rate limits, CORS policies, and failure modes.
I built what I call a “proxy matrix”, a cascading fallback system that tries multiple routes to reach each data source. If one path is blocked, it bounces to the next. Some APIs work directly from the browser. Others need to be routed through intermediary services. The system figures out what works in real time and adapts.
Every data source has error handling. Every panel has a timeout. If an API goes down, that panel shows a graceful failure message instead of breaking the entire dashboard. The architecture is fundamentally resilient because it was built during an actual crisis where APIs were going down constantly.
The AI Layer
The dashboard includes an AI SITREP generator. It takes the current state of all theaters, GDELT headlines, market indicators, and escalation signals, synthesizes them through Claude, and produces a formal intelligence brief in the style of a military situation report. If you have got Claude API key, you can use your own key to generate Sitrep, that you can use in your blog or social media posts. By the way, we cannot see your API key.
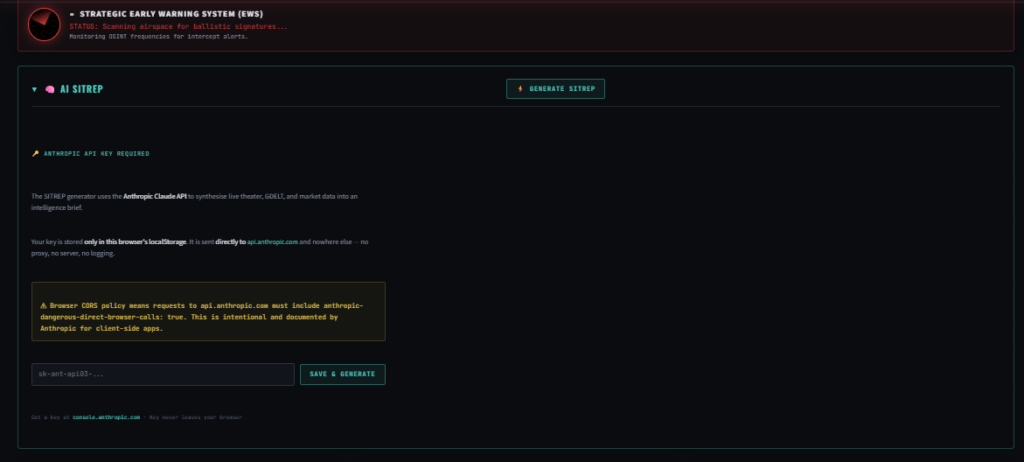
There’s also an automated escalation detection system that monitors GDELT article volumes across keyword clusters (airstrike, nuclear, cyber, mobilization, etc.) and fires alerts when volume spikes exceed configurable thresholds compared to a rolling baseline. This has actually detected real escalations before they hit mainstream news.
What You Get
The Command Map
Interactive 3D globe with real-time satellite tracking (21+ ISR satellites), conflict zone overlays, strike arc animations, carrier group positions, and seismic ring overlays. Battlefield maps from DeepState (Ukraine) and War Mapper (Middle East).
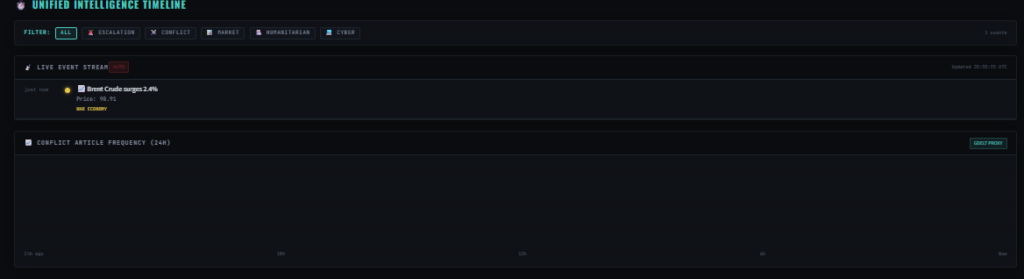
Unified Timeline
A chronological event stream that merges GDELT conflict articles, escalation alerts, market moves, and nuclear signals into one filterable feed. Conflict article frequency sparkline shows 24-hour volume trends.
Intel Briefs
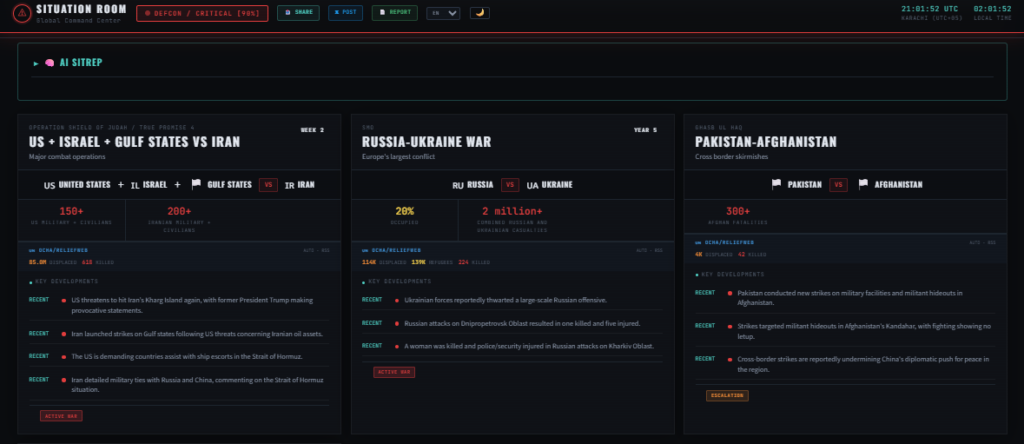
Theater cards for each active conflict with AI-generated developments, casualty tracking, and OCHA/ReliefWeb humanitarian data. AI SITREP generator produces on-demand intelligence briefs.
Nuclear Threat Assessment
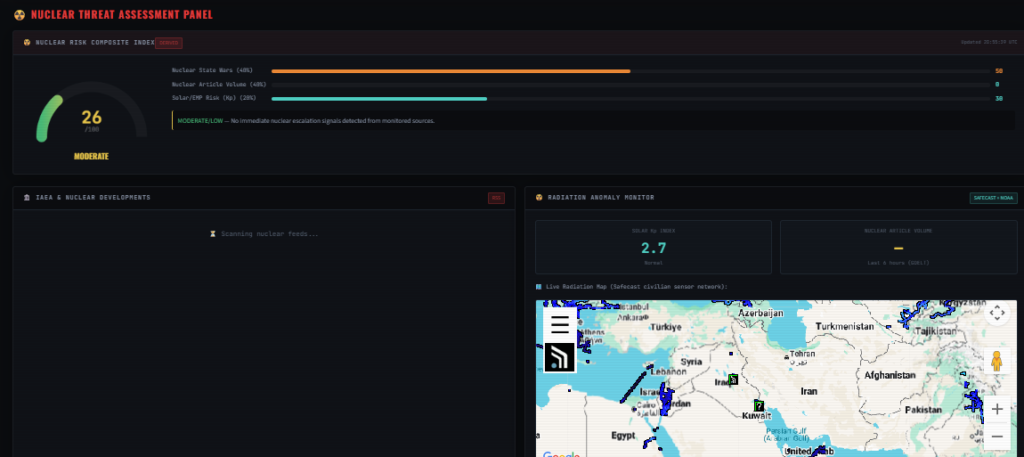
Composite nuclear risk index derived from active nuclear-state wars, GDELT nuclear article volume, and solar Kp index. IAEA news feed, radiation anomaly monitoring via Safecast, and nuclear-capable nations status grid with warhead counts.
War Economy
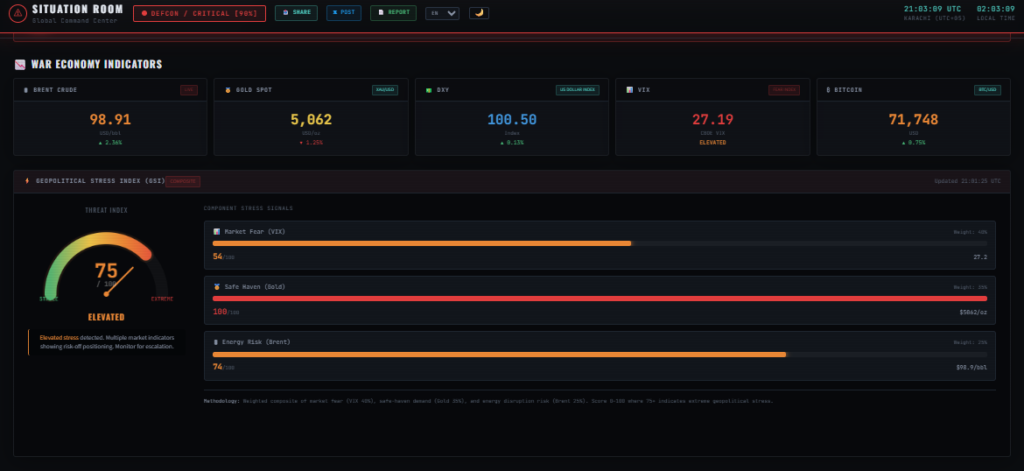
Live Brent crude, gold, VIX, DXY, and Bitcoin prices with change indicators. Geopolitical Stress Index composite gauge. Defense sector tracking. TradingView chart embeds for all conflict-correlated assets.
And More…
Social intelligence from Bluesky and Telegram. Cybersecurity threat monitoring. Flight tracking over conflict airspace. Naval vessel tracking in strategic waterways. Internet shutdown detection via BGP routing analysis. Space weather and radiation monitoring. Shodan IP reconnaissance. GPS jamming detection.
By the Numbers
- 25+ verified OSINT data sources
- 4 active conflict theaters tracked in real time
- 21 ISR satellites with real orbital data
- 13 navigation tabs covering every domain of intelligence
- 5 languages (English, Persian, Urdu, Arabic, Russian) with RTL support
- 60+ JavaScript functions in a single self-contained HTML file
- Zero backend servers, zero databases, zero user tracking
- Completely free, completely open source
What’s Next
The Situation Room is a living project. It evolves as conflicts evolve. New theaters get added. New data sources get integrated. The architecture is designed to be extended, every panel is modular, every data source is swappable.
I’m exploring automated social media updates, email intelligence digests, and embeddable widgets that other sites can use. If you’re an OSINT researcher, journalist, or just someone who wants to understand what’s actually happening in the world, I built this for you.
Try it yourself. It’s free. It’s live. And it’s watching.