
What We Found
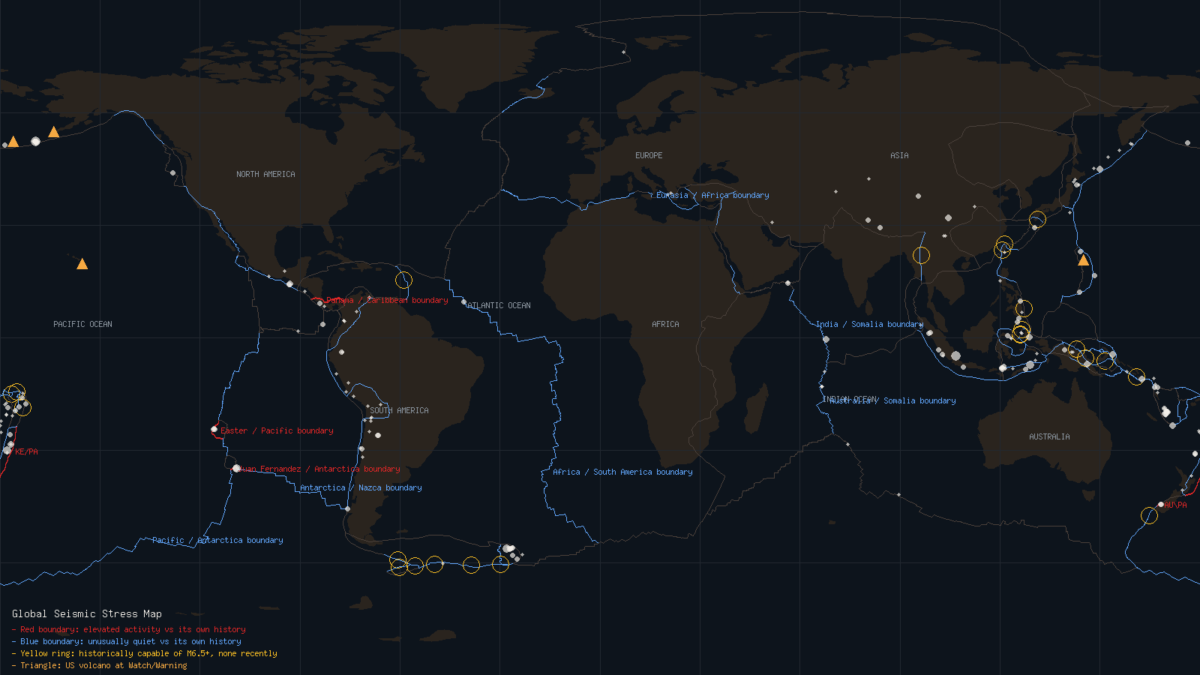
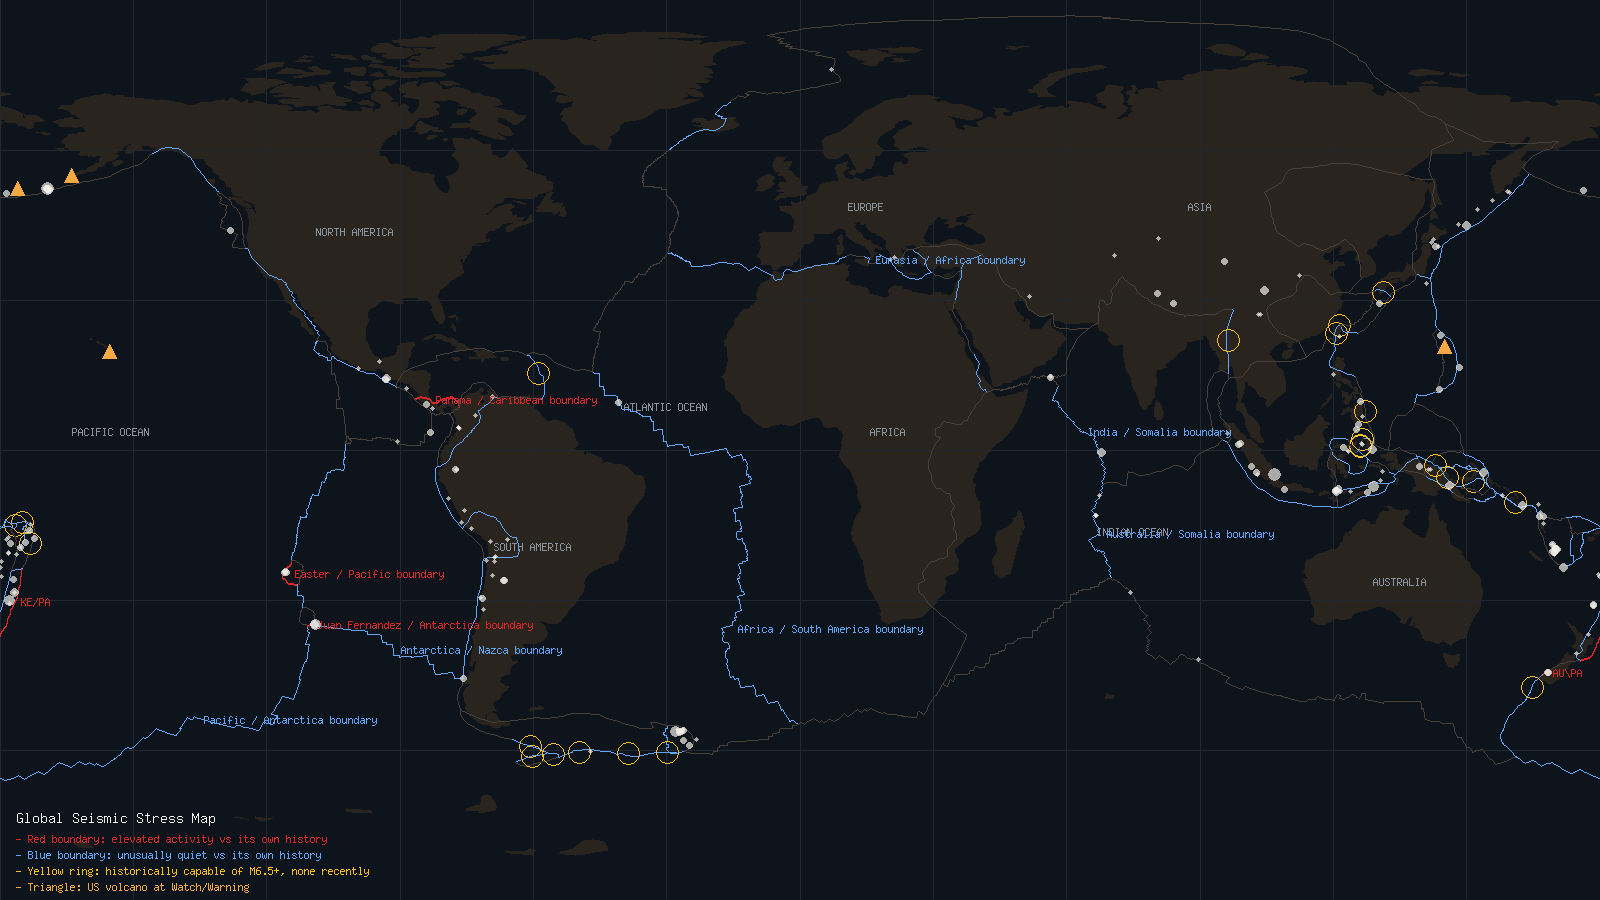
We looked at 200 earthquakes (magnitude 4.5 or bigger) recorded worldwide in the last 14 days, and compared activity in 241 major fault zones worldwide against each zone’s own long-term average.
Here’s the core idea, said once, simply. Earthquakes happen when built-up pressure along a fault gets released. A fault zone that’s normally active but has gone unusually quiet may be building up pressure instead of releasing it regularly – that’s what scientists call a fault going quiet for longer than its history suggests it should. The flip side also matters: a zone releasing far more energy than usual is actively unloading pressure right now.
Zones With More Earthquakes Than Usual
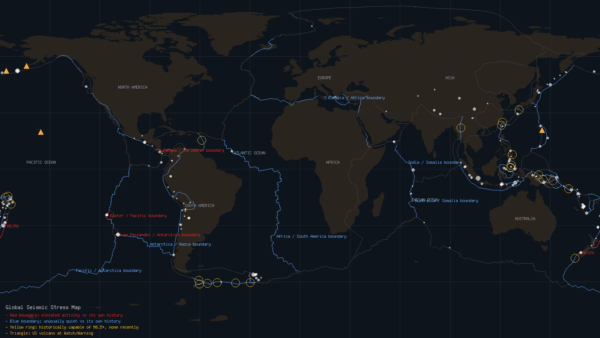
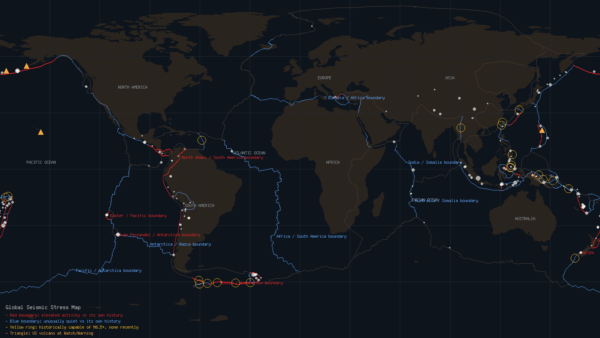
The Easter / Pacific boundary, out in the remote South Pacific, has had 3 earthquakes in the last two weeks, releasing about 20.7 times the seismic energy this zone normally releases in a fortnight. The biggest recent one was magnitude 5.2; the largest in its 3-year history is 5.5. This is the first time we’ve flagged this zone.
The Juan Fernandez / Antarctica boundary, also in the South Pacific, has had 2 earthquakes, releasing about 17.1 times its usual two-week energy. The largest recent quake was magnitude 5.9, against a 3-year record of 6.3. First time flagged.
The AU\PA zone, near the ocean south of New Zealand, has had 2 earthquakes, about 13.8 times its normal two-week energy. Largest recent: magnitude 5.3. First time flagged.
The KE/PA zone, near the Kermadec region northeast of New Zealand, has had 2 earthquakes, about 4.1 times its normal energy. To be clear: most of that came from ONE large earthquake (magnitude 5.8) and its aftershocks, not many separate events. This is not widespread unrest. First time flagged.
The Panama / Caribbean boundary has had 1 earthquake, about 2.7 times its normal two-week energy. Largest recent: magnitude 5. First time flagged.
Zones That Have Gone Quiet
The Australia / Somalia boundary, in the Indian Ocean, normally sees a small amount of activity – about 0.05 earthquakes every two weeks on average – but has had zero recently. Based on the data we have, this suggests pressure may be building there rather than being released. First time flagged.
The Eurasia / Africa boundary, running through the Mediterranean region, averages about 0.04 earthquakes every two weeks and has had zero. Same idea: pressure may be accumulating. First time flagged.
The India / Somalia boundary, also in the Indian Ocean, averages about 0.08 every two weeks and has had zero. First time flagged.
The Africa / South America boundary, in the South Atlantic, averages about 0.06 and has had zero. First time flagged.
The Antarctica / Nazca boundary, in the southeast Pacific, averages about 0.05 and has had zero. First time flagged.
The Pacific / Antarctica boundary, far in the Southern Ocean, averages about 0.09 and has had zero. First time flagged.
One honest caveat on these quiet zones: their normal averages are very small to begin with, so two quiet weeks is not, on its own, dramatic. We flag them so we can watch them over time, not because any of them is an alarm bell today.
Volcanoes Worth Knowing About
An eruption is another way built-up underground pressure gets released, alongside earthquakes. Right now, two U.S. volcanoes are at Watch level. Great Sitkin in Alaska has a slow eruption of lava continuing inside its summit crater, with weak earthquake activity. Kilauea in Hawaii is intermittently erupting short lava flows – over 100 have been recorded since activity began September 7 – and another fountaining episode is considered likely soon if ground swelling patterns hold. Two more are at the lower Advisory level: Shishaldin in Alaska, with continuing low-level unrest, and Ahyi Seamount in the Northern Mariana Islands, where satellite images show faint water discoloration but no significant underground signals.
Our Track Record So Far
Here’s what makes this a measured signal instead of just a guess. Across 3 of our past reports old enough to check, we flagged 14 zones total. Of those, 2 later had a magnitude 6 or bigger earthquake within 90 days. That’s a small sample – we’re early in this project – so we report the plain counts rather than dressing them up as a percentage. We’ll keep updating this tally every report.
A real-world example shows both why patterns like this matter and why humility matters too. Parkfield, California, a short stretch of the San Andreas Fault, had produced a moderate magnitude-6 earthquake roughly every 22 years for over a century – a clear pattern that led scientists to publicly expect the next one around 1988. It didn’t actually happen until 2004, 16 years later than predicted. Real long-term patterns exist in some fault zones, but even a well-studied one can’t be timed precisely.
What This Doesn’t Tell Us
No scientist can predict exactly when or where an earthquake will strike. This report is just tracking real patterns over time. A quiet zone is not guaranteed to have a big earthquake – and a busy zone releasing energy now may be lowering its own risk, not raising it.